Monitoring Nginx with CloudWatch
Using Nginx as a reverse proxy makes it a gatekeeper that is every request to our server
goes through it, and Nginx keeps track of all of those requests in its access logs.
Nginx's access logs provide us with valuable information like response
time, response size and status code. In this article we will use AWS CloudWatch to fetch and
parse Nginx logs to get the average response time.
Configuring Nginx
Nginx uses log_format directive to configure the logging format. We will
be using the default format, but if you want to edit the configuration file or just want to make sure it is same as with this one, head over to /etc/nginx directory and check out nginx.conf file. Make sure log format directive includes $upstream_response_time as shown below.
log_format  main  '$remote_addr [$time_local] "$request" '
            '$status $body_bytes_sent $upstream_response_time "$http_referer" '
            '"$http_user_agent" "$http_x_forwarded_for"';
A Note for Docker Users
If you are using Nginx inside a Docker container, you need to add a persistent storage to store the logs. Because the official Nginx image
creates a symbolic link from /var/log/nginx/access.log to /dev/stdout, which is not persistent.
To be able to store the logs in the host machine, make sure to add a bind mount as shown below:
volumes:
    - /var/log/nginx/:/var/log/nginx
Installing the CloudWatch Agent
Cloudwatch agent is used to fetch the Nginx logs from EC2 instance to CloudWatch. If you are using Amazon Linux 2 image, you can install the agent with the command below:
sudo yum install amazon-cloudwatch-agent
For all other supported operating systems, you can download and install the CloudWatch agent using the commands listed on the documentation.
Creating IAM Role
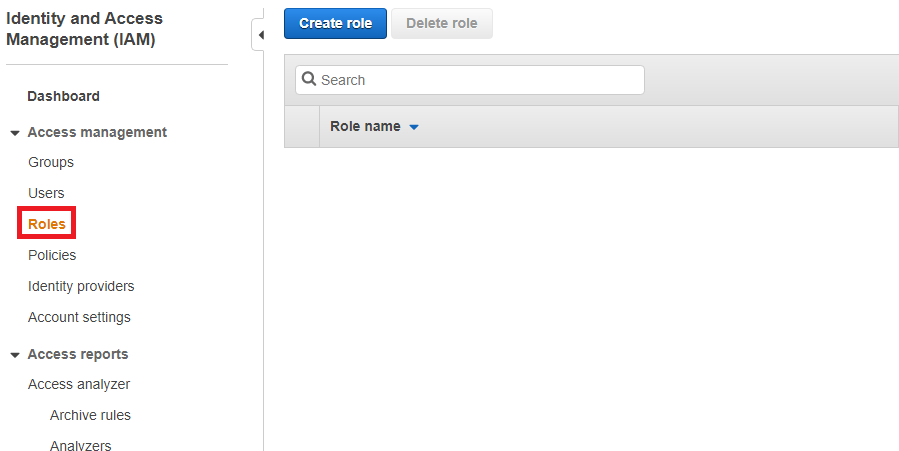
After installing the CloudWatch agent, you must also make sure that the IAM role CloudWatchAgentServerPolicy is attached to the EC2 instance. It is because accessing to AWS resources requires permissions. We need to create an IAM role that gives permission to CloudWatch agent to write metrics to CloudWatch. First, go to IAM page and open up Roles tap. Then, click the Create Role button. Then, select EC2 and click the Next button.
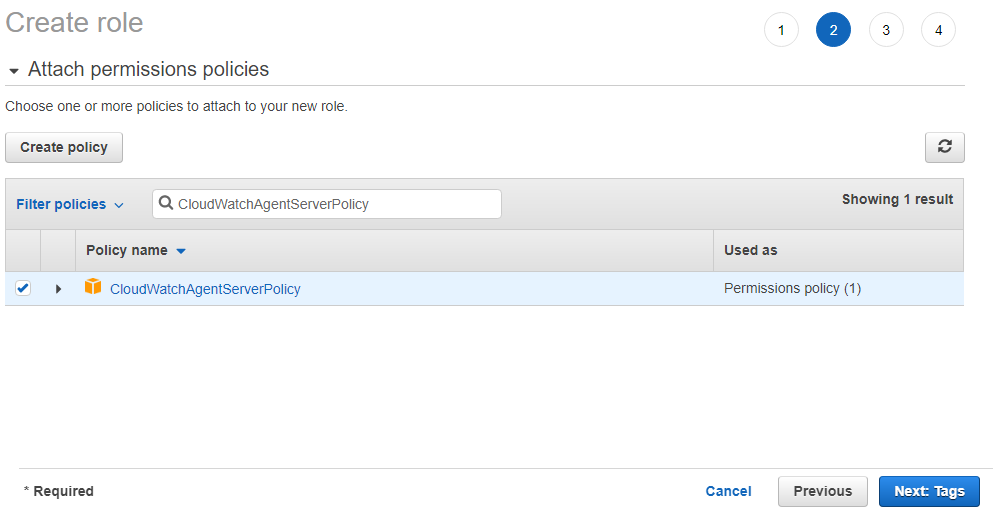
On Create Role page, search for CloudWatchAgentServerPolicy, then click next.
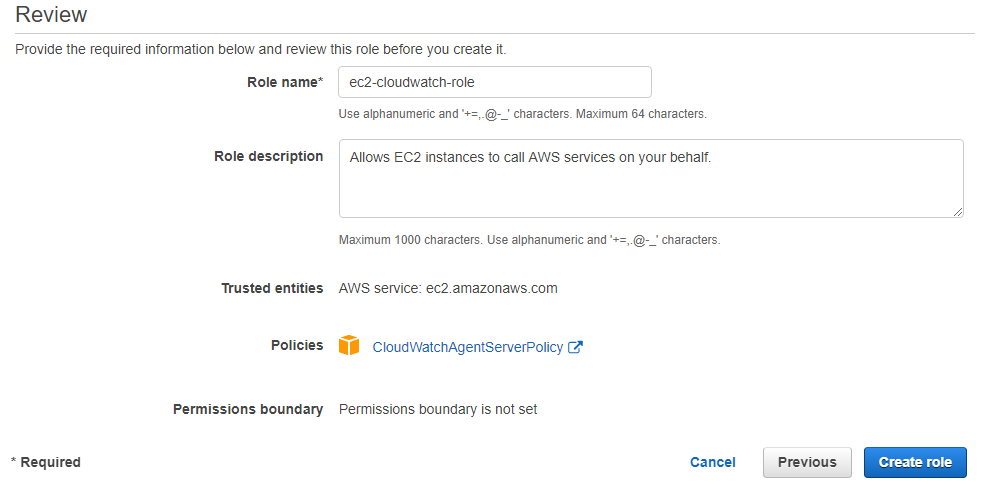
In the next page, you can optionally add a tag for this role. In the last page, you need to fill Role Name field, then you can click the Create Role button to finalize this process.
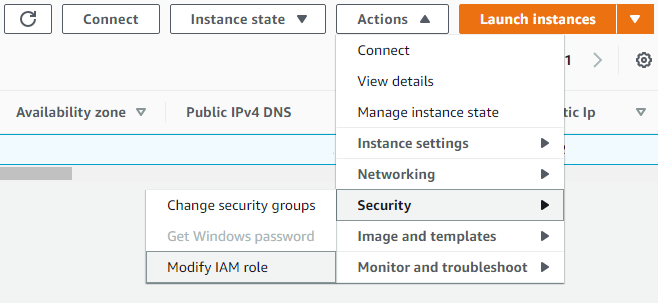
As a final step, we need to attach this role to the EC2 instance from which logs will be retrieved. Go to EC2 page on AWS console, and select the instance, then click the Actions button and select Modify IAM role button under Security section. Then, attach the role we just created.
Configuring CloudWatch Agent
Now that the CloudWatch agent is installed, IAM role is attached; it is time to configure the agent. The agent configuration file is in JSON format which specifies logs that we want to be collected. Configuration file can be created by using a wizard or manually. You could also use the wizard to initially create the configuration file and then modify it manually. We will use the wizard to configure the agent. Use the command below to run the wizard:
sudo /opt/aws/amazon-cloudwatch-agent/bin/amazon-cloudwatch-agent-config-wizard
The wizard will ask a series of questions:
- On which OS are you planning to use the agent? Answer: 1
- Are you using EC2 or On-Premises hosts? Answer: 1
- Which user are you planning to run the agent? Answer: 1
- Do you want to turn on StatsD daemon? Answer: 2
- Do you want to monitor metrics from CollectD? Answer: 2
- Do you want to monitor any host metrics? Answer: 2
- Do you have any existing CloudWatch Log Agent? Answer: 2
- Do you want to monitor any log files? Answer: 1
- Log file path:
/var/log/nginx/ - Log group name:
nginx - Do you want to specify any additional log files to monitor? Answer: 2
- Do you want to store the config in the SSM parameter store? Answer: 2
Question number 9 and 10 are important. You need to make sure that the file_path is the path where we saved the access log file. And, we will be using the Log group name we just set in question 10 in a moment. Now run the following command to start the agent:
sudo /opt/aws/amazon-cloudwatch-agent/bin/amazon-cloudwatch-agent-ctl -a start
You can check agent's status with:
sudo /opt/aws/amazon-cloudwatch-agent/bin/amazon-cloudwatch-agent-ctl -a status
Creating Log Group
Now, go to CloudWatch page on AWS and open up Log groups tab, then create a log group. Make sure to name it nginx, because we chose nginx as our Log group name in question number 10 above. Those two must match.
Setup Metric Filters
Click the log group nginx you have just created. Click the Actions button on the top, then click Create metric filter button. Fill Filter Pattern field with the expression below:
[client, date, request="GET /*", status_code, body_bytes_sent, response_time, http_referer, http_user_agent, http_x_forwarded_for]
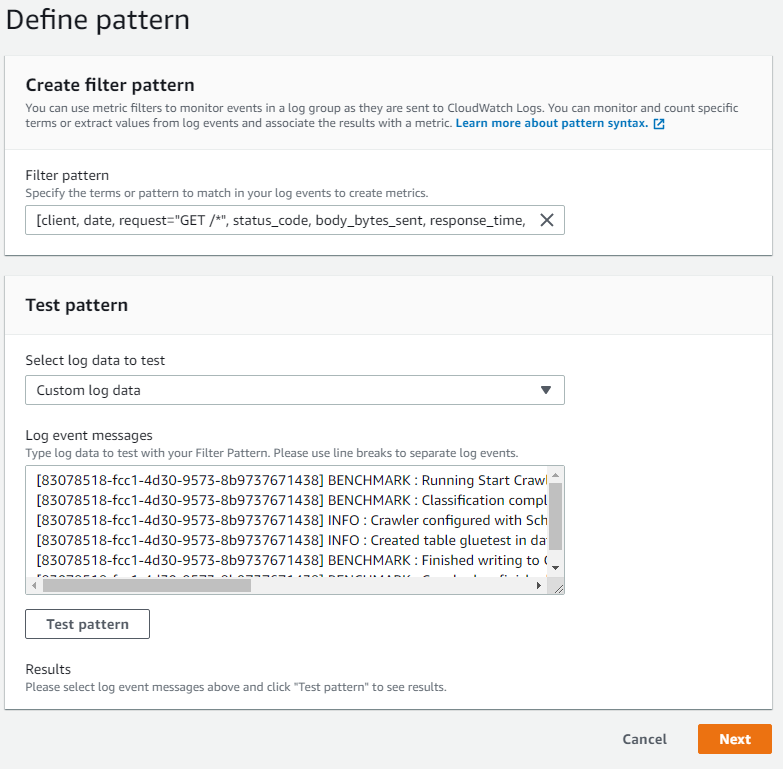
This pattern will filter all the Get requests that our server gets. Click next, and fill Metric Details page as follows:
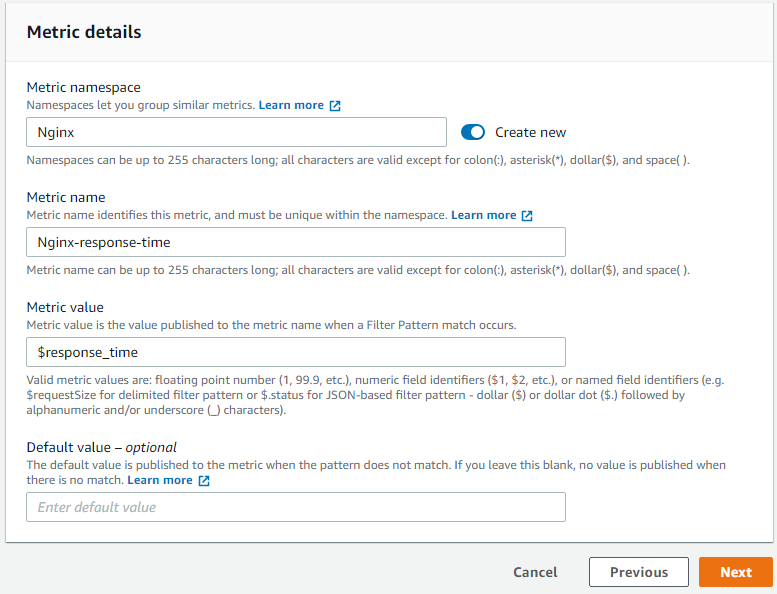
Please note that Metric value field is set to $response_time. Now that metric is created, we can go to Metrics section to explore the graph.
It might take up to 10 minutes to propagate.
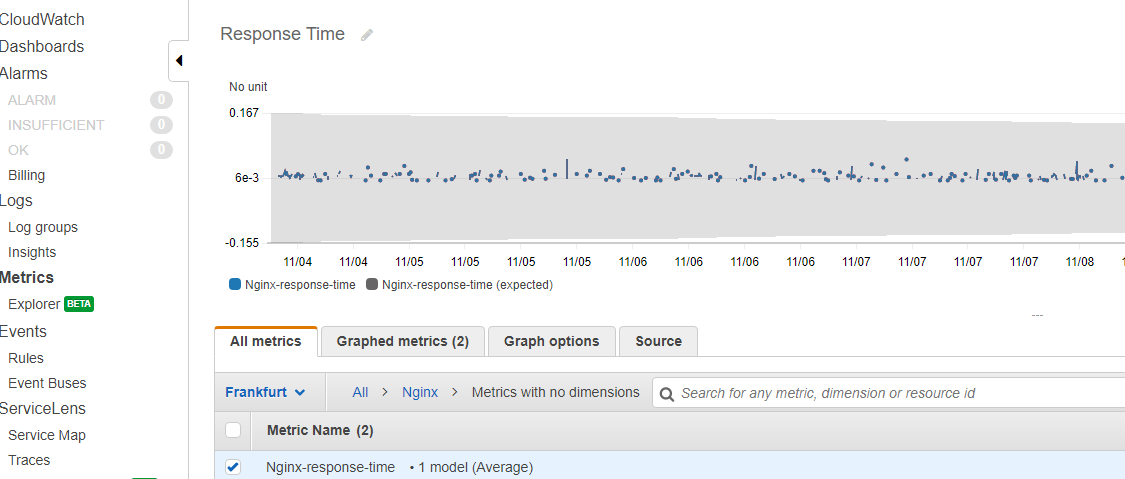
Conclusion
In this article we learned how to retrieve Nginx logs from EC2 instance to CloudWatch, parse the logs with filters, and create a graph to visualize Nginx response time.
Tell me what you think on Twitter!